"ILT1000/Y/W"

ILT1000/Y/W
Two Systems - Smart Sensors for Monitoring UVA And Lux In Long-Term Studies Of Degradation
- Wired & WIRELESS Versions Available
- Ideal for Performing Multi-Point, Wireless, Remote Light Monitoring & Data Logging
- “Set It & Forget It” Remote Data Logging with On-Board Data Storage
- Multi-System Continuous Monitoring (up to 32 systems with one hub)
- 4 Open Licensed, Customer-Configurable Software Options
- 6 Decade Dynamic Range of Optical Analysis
- Autorange, Autodark with Manual Control Options
- 4-20 mA Output
- Auto-Sample Rate Configuration to Reduce Noise
- NIST-Traceable Calibration and Certificate
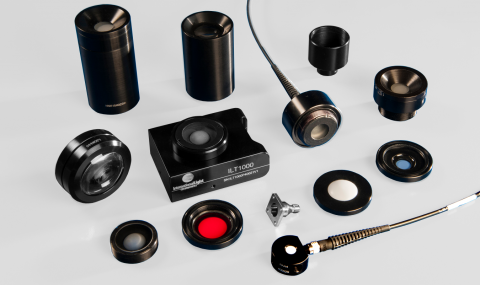
- Many Pre-Configured Application-Specific Detector/Filter/Optics Combinations Available
- Custom and OEM Version Inquiries Welcome
- Made in USA
- Size: 76.2 x 76.2 x 25.4 mm (3" x 3" x 1")
- Weight: 173 g (less than 0.5 lbs)
- Custom & OEM Inquiries Welcome!
< Back to Photostability Light Measurement Table
Rugged, Compact, Multi-purpose, Multi-point Smart Sensor for Monitoring UVA and Lux in Long-Term Studies of Degradation

ILT1000/UVA/W for UVA and ILT1000/Y/W for VIS
Photostability testing typically consists of simultaneous UVA and Lux monitoring inside a sealed chamber. The ILT1000's ability for wireless output of data and/or internal data storage allows the user to take measurements without risk of negative effects from ambient light or light leakage which can occur when the chamber door is left open during test.
Dynamic Range: UVA: 2e-3 to 1e+3 W/m2; VIS: 6e-1 to 5e+5 lux
Spectral Range: UVA: 315-390 nm; VIS: 400-700 nm
Order part numbers: qty 2 ILT1000 with W, qty 1 UVA, Y2, PIR and YIS calibration
ILT1000 can be used remotely when powered by any USB source (wall, phone charger, computer, portable power bank) and record readings using the “Set it & forget it” datalogging software.
For wired monitoring we offer three easy to use software packages. CLI for the technical savvy customers who wish to write their own code, TREND and BAR.
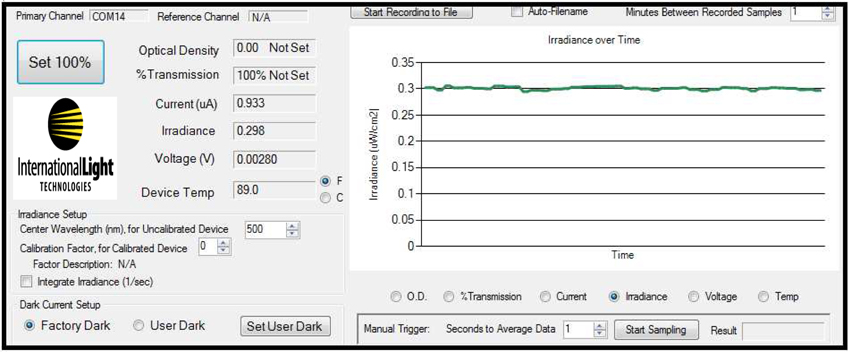
TREND - Records all 6 parameters while displaying the trend over time for the user switchable parameter. Multiple examples of trend can be run simultaneously to allow multi-unit comparisons.

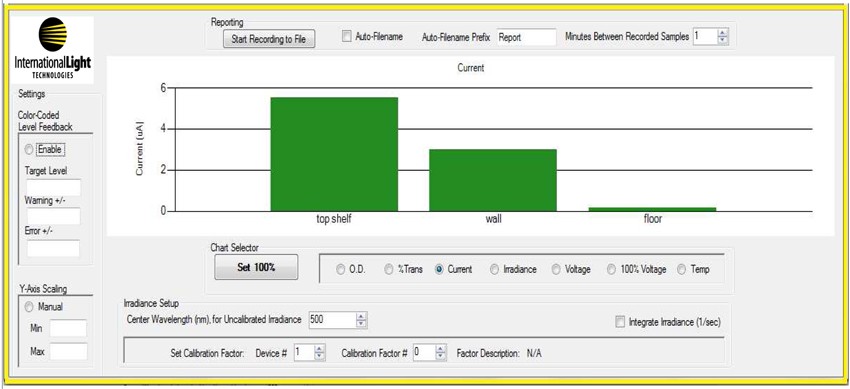
BAR - Allows multi-system, datalogging and displays the user switchable parameter in a bar graph. The expandable graph can accommodate up to 32 systems simultaneously with use of hub(s). User can enter nicknames for each unit to define the location, application, version, serial number, etc. Customer can program max and min warning levels and use color coded bar responses for easy troubleshooting.

For the latest meter specifications, data sheet, installation guide, tech notes and software, visit the ILT1000 page here.

