How it Works

Miniature spectrometers discriminate the wavelength based on the position the light hits at the detector array allowing the full spectrum to be obtained with a single acquisition. Their compact size and ease of operation make them widely used in many different spectroscopic measurements applications, such as color analysis, concentration determination of chemical components or absolute optical radiation measurements. This article provides the specification of various ILT spectrometer models and explains how we quantify these specs to help our customers select the best solution for their specific application through better understanding of the specifications
ILT spectrometers are based on the Czerny-Turner design. The input light illuminated entrance slit is dispersed through gratings and imaged onto the linear array detector through collimating and focusing spherical mirrors. The detector converts the optical signals to electronic signal and the electronics board magnifies, digitizes and transfers the data to the computer.
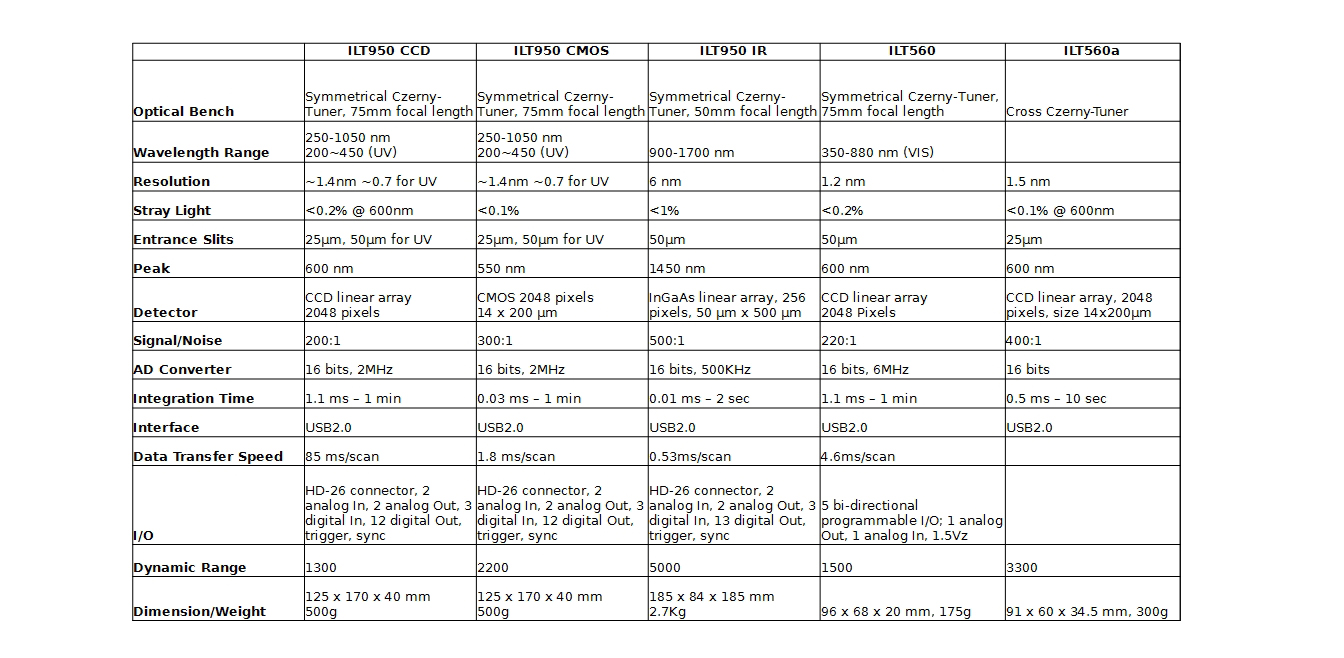
The specs of the ILT models are listed below in Table1. The following is more detailed explanation of the table.
1. Wavelength range and resolution
The effective wavelength (spectral) range is determined not only by the grating dispersion ability but also depends on the detectors’ sensitivity range. Limited by the semiconductor’s band gap the silicon based detector responds to 200-1100nm while the InGaAs based detector is sensitive to 900-1700nm.
Resolution defines the spectrometers’ ability to resolve the smallest adjacent wavelength peaks, which is directly related to the slit width, grating and the pixel size of the detector array. Smaller slit widths lead to higher resolution, but at the price of lower system throughput of the incoming light.
In order to allow a balance of system throughput and spectral resolution as well as to match the detector’s sensitivity range, ILT950 and 560 systems were pre-configured to meet various resolution, wavelength and dynamic range requirements. For broad spectral coverage from UV to NIR (up to 1050nm) we recommend ILT950 or ILT560a with 25um width slit; for UV measurement (200 to 450 nm) ILT950UV with 50um width slit is suggested and for application above 900nm the ILT950NIR with InGaAs CCD detector is available. The ILT560 and ILT560I include a 50um slit, mainly for applications in visible and NIR range respectively. Two or more spectrometers can be combined to meet the extended spectral coverage requirement. For example ILT950 and ILT950NIR can be combined with a bifurcated fiber and single input optic to measure light from UV to NIR (up to 1700nm).
2. Stray Light
Stray light is unwanted wavelength radiation reaching the incorrect detector element. It generates erroneous electronic counts not related to designed spectral signal for the pixel or element of the detector array. It can come from light scatter and reflection of imperfect optical elements as well as higher order diffraction effects. The second order effect can be removed or at least dramatically reduced, by installing order sorting filters before the detector, like our ILT950 and ILT560A.
Si detector sensitivity to visible and NIR is nearly an order of magnitude larger than that in the UV range. This means that the pixels at the UV spectral position respond to stray light in visible and NIR much more strongly than to their own designed spectral signal. Therefore the stray light impacts in UV region are much more significant as compared to visible and NIR pixels. This situation gets worse the shorter the wavelength.
When measuring broad band light with small fraction of UV signals, the stray light impact can sometimes be dominant in the UV range since the detector pixels are already struggling to get enough UV signals from the source. For this reason calibration using QTH standard lamp can have huge errors (more than 100%) below 350nm and Deuterium standard lamp is required for more accurate calibration in this region. In fact, absolute light measurement in the UV region can have large errors even with the correct calibration when majority of the electronic counts in these pixels is result of the stray light (longer wavelength strikes instead of the actual UV light).
Stray light measurement is conducted using a tungsten lamp and long-pass filter with a known cut-off wavelength and transmission spectrum. The residual transmission in the blocking band indicates the stray light effects from passing band.
3. Sensitivity Spectrum
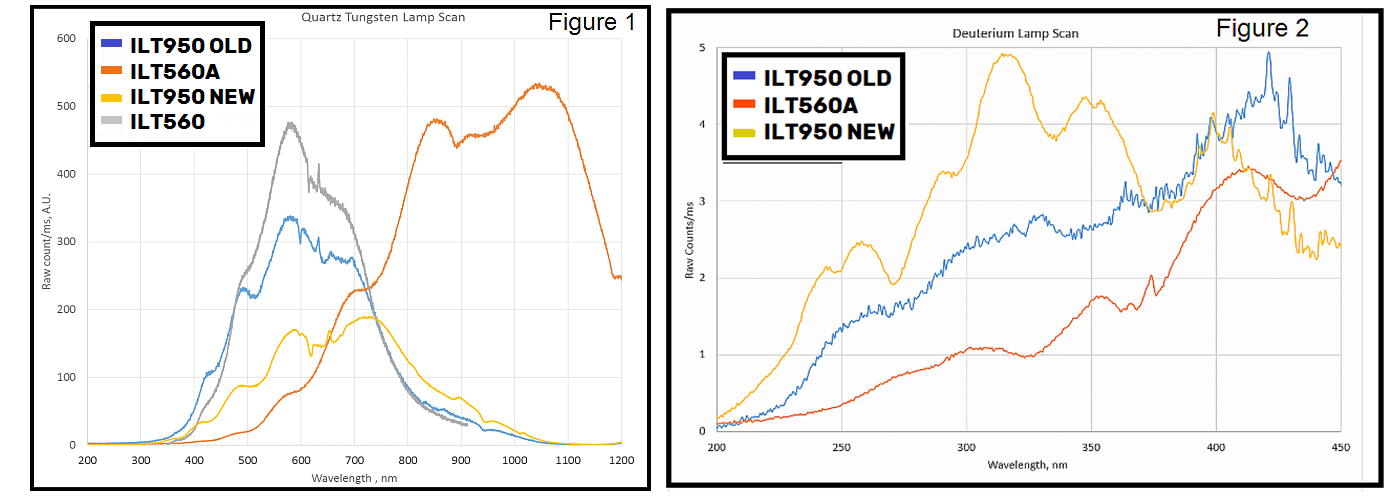
As mentioned earlier the spectral detection range is limited by the semiconductor material based on which the detector is used. However the overall Sensitivity Spectrum of the system depends on both the optical throughput and the detectors’ sensitivity. Figure 1 and 2 below display the recorded spectrum scan of several ILT models in front of the standard QTH and Deuterium respectively. For comparison purpose all the spectrum are normalized to the integration time.
In 2018, the ILT950 switched from CCD to a CMOS type sensor and the ILT560A replaced the retired ILT550 model, both with greatly improved performance. Compared to the old model the sensitivity of new ILT950 is nearly doubled in the UV region and about half in visible range. As such it provides more balanced sensitivity spectrum from UV to NIR, making it a better choice for general broad band measurement. In addition thanks to the faster CMOS sensor the minimum possible integration time has been greatly reduced for ILT950 from ~1ms to 3us so that the new model is capable for much stronger light. ILT560A has greater response to near infrared light (above 750nm) and is suitable for broad band application with more interest in the NIR region.
4. S/N and Dynamic Range
The electronic signal converted by the detector is digitized with A/D module, whose bits number determines the maximum digital counts. 16 bits A/D is used for all ILT models and the full scale is 216-1 (65,535) in counts.
S/N ratio is measured at the input light level which reaches the full scale of the spectrometer. It is the ratio of signal counts Cs (usually at full scale) to RMS (root mean square) noise at this light level. This noise includes the dark noise Nd, the shot noise Ns related to the counts generated by the input light and read out noise. This is the best S/N ratio one can get from the spectrometer for light measurements.
Dynamic range is the ratio of full scale counts to the RMS of dark noise only. It is a pure measure of electronic circuits and has nothing to do with the external input light level.
Compared to the ILT550 (not shown), ILT560A has much lower dark noise and uses a 16 bit AD converter instead of 14 bits one.
Table 1. ILT Spectrometer Models


